
Your e-bike’s diagnostic system isn’t just hiding features to upsell dealer services; it’s a carefully designed liability firewall.
- Consumer apps offer a view-only ‘API’ into health metrics, while dealer tools hold the ‘write access’ keys for safety-critical functions.
- The difference is driven by legal liability and security protocols, not just business strategy.
Recommendation: Use consumer apps for data-driven triage and predictive monitoring, but understand the ‘digital handshake’ that makes the dealer essential for critical resets.
As a tech-savvy e-bike owner, you’ve likely felt the frustration. Your bike is a sophisticated piece of technology, a rolling IoT device, yet its inner workings are often a black box. When a warning light flashes, the common advice is a simplistic and unsatisfying “take it to your dealer.” You know there’s more data available—battery health, sensor logs, historical faults—but it seems locked away behind a proprietary wall. You’re comfortable with tech, you manage other complex systems, so why should your bike be any different?
The standard approach of just reading a manual or blindly trusting a mechanic misses the point. It ignores the wealth of information your bike’s sensors are generating on every ride. The real challenge isn’t just fixing problems as they appear, but leveraging data to predict them before they leave you stranded. This requires a shift in mindset: from a simple rider to a system administrator of your own vehicle.
This guide breaks through that proprietary wall. We’re not just going to list error codes. We’re going to decode the ‘API’ of your bike’s health. We will explore the technical and liability-based logic that dictates what you can see, what you can fix, and how you can use the data you *do* have access to. Forget the platitudes; we’re diving into the system architecture to understand the ‘why’ behind the diagnostic curtain.
This article will guide you through the layers of your e-bike’s diagnostic capabilities. From understanding the true meaning of battery health percentages to deciphering the security protocols that protect manufacturers, you will learn to read your bike’s health report like a developer, turning abstract data into actionable, predictive insights.
Summary: Reading Your E-Bike’s Diagnostic Data
- State of Health (SoH): What Does 85% Capacity Really Mean?
- Deciphering Common Bosch/Shimano Error Codes at Home
- Dealer Dongle vs Consumer App: What Can You Actually Fix?
- The Risk of Torque Sensor Miscalibration Affecting Assist
- Checking for Water Ingress in Connector Ports
- How to Pair Your Heart Rate Monitor with the Bike Display
- Why Only Dealers Can Reset Error Codes on Premium Systems
- Integrated Handlebars vs Standard Stems: Is the Clean Look Worth It?
State of Health (SoH): What Does 85% Capacity Really Mean?
The State of Health (SoH) percentage displayed in your app is the single most important long-term metric for your e-bike, yet it’s widely misinterpreted. It’s not just a fuel gauge; it’s a measure of your battery’s degradation. A reading of “85% SoH” means your battery, when fully charged, can only hold 85% of the energy it could when it was new. This isn’t a linear decline. The first 5% of capacity is lost much faster than the next 5%. A tech-savvy owner treats this not as a single data point, but as the start of a personal degradation curve.
By tracking your SoH quarterly against your mileage and riding style (e.g., high-assist eMTB vs. flat commuting), you can build a predictive model. This curve allows you to forecast when you’ll hit a critical threshold—typically 70-75%—where the range becomes insufficient for your needs. It transforms a surprise “dead battery” into a predictable, budgetable maintenance event. It’s important to have a realistic baseline; recent battery performance data shows that an 85% median capacity retention in 8-9 year old EV systems is a common benchmark, giving you a long-term perspective on performance.
Furthermore, calculating your “cost per percentage point” by dividing the replacement cost by your current SoH gamifies the process. You start seeing how certain behaviors, like charging to 100% every time or storing the battery in a hot garage, directly impact a real monetary value. This data-driven approach shifts your perspective from simply using a battery to actively managing a valuable, depreciating asset.
Deciphering Common Bosch/Shimano Error Codes at Home
When an error code flashes on your display, the instinct is to panic. However, for a developer, an error code isn’t a failure; it’s a data point. E-bike manufacturers like Bosch and Shimano use a tiered system for errors, which you can think of as a data-driven triage protocol. Not all codes are created equal, and your first job is to categorize the alert’s severity. This is where you can perform diagnostics at home before even thinking about a dealer.
The system can be broken down into a simple color-coded framework. Green codes are typically user-serviceable—think of a loose battery connection or a misaligned speed sensor magnet. Yellow codes are warnings; they often indicate a temporary software glitch or a non-critical motor system error that might be resolved with a simple reboot. Red codes are the critical alerts. These signal a persistent failure in a core component like the motor or battery firmware, and they mean you should stop riding immediately. The image below visualizes this sorting process—turning chaotic signals into an organized diagnostic plan.

By logging these codes with the date, riding conditions, and any attempted fixes, you build a fault history. This log is invaluable. It helps you identify patterns—does a specific yellow error only appear after riding in the rain? Does a reboot consistently clear another? This information is gold for a dealer technician if you do need professional help, transforming your service request from “my bike is acting weird” to “I’m getting a recurring error 503 under high torque, and a reboot clears it for about 10 miles.”
Your Action Plan: Implementing a DIY Triage System
- Categorize the alert: Identify the error code’s ‘color’ on your display. Is it a simple notification (Green), a system warning (Yellow), or a critical failure (Red)?
- Log the event: In a spreadsheet or notebook, record the date, error code, and specific riding conditions (e.g., high torque, wet weather, after a bump).
- Cross-reference physical symptoms: Check for obvious physical issues that match the code’s category, like inspecting battery contacts for a Green connection error.
- Identify patterns: Look for correlations between your log and “ghost” issues. Does an intermittent power loss always follow a specific Yellow code?
- Execute your action plan: Based on the triage, decide your next step: perform a DIY fix (Green), reboot and monitor (Yellow), or schedule a dealer visit with your detailed log (Red).
Dealer Dongle vs Consumer App: What Can You Actually Fix?
The divide between what you can see in a consumer app and what a dealer can access with their diagnostic tool is the source of much confusion. It’s not an arbitrary limitation; it’s a deliberate system architecture. Think of your consumer app (like Bosch’s eBike Flow) as having read-only API access. It can poll the system for basic status information: battery SoH, current firmware version, and non-critical error codes. It’s designed for monitoring.
The dealer’s diagnostic tool, however, has write access. This is the key difference. It’s a secure terminal that can issue commands to the bike’s core firmware. This includes resetting critical, safety-related error codes, writing new motor firmware, performing a deep cell balance on the battery, and calibrating sensors. This functionality is locked behind a secure hardware “dongle” and often requires an active connection to the manufacturer’s servers for authentication. This creates what can be called a ‘liability firewall,’ ensuring that changes to safety-critical systems are performed and logged by a trained professional. As one technician put it:
Using the Bosch eBike Diagnostic Tool 3 correctly requires a solid understanding of eBike systems. Attempting to modify settings without proper knowledge can potentially damage your eBike.
– John Miller, Senior eBike Technician, Car Scan Tool Guide
The table below, based on an in-depth analysis from e-bike communities, clearly shows this separation of powers. You can diagnose, but the dealer has to execute the fix for anything that touches the core system integrity.
| Function | Consumer App | Dealer Tool Only |
|---|---|---|
| Read basic error codes | ✓ | ✓ |
| View battery health percentage | ✓ | ✓ |
| Reset critical error codes | ✗ | ✓ |
| Write motor firmware | ✗ | ✓ |
| Deep battery cell balancing | ✗ | ✓ |
| Access historical fault logs | Limited | ✓ Full access |
| Torque sensor calibration | ✗ | ✓ |
| Component compatibility check | ✗ | ✓ |
The Risk of Torque Sensor Miscalibration Affecting Assist
One of the most subtle yet frustrating diagnostic challenges is a drifting torque sensor. Unlike a clear error code, this manifests as a degraded user experience. You might feel a jerky or laggy power delivery, a “ghost” assistance when you’re not pedaling, or a sense that you’re working harder than you should for a given assist level. This is your bike’s most important input sensor telling the motor incorrect information about your effort.
From a data perspective, a key symptom is a divergence between perceived effort and power consumption. If you notice your battery draining significantly faster on a familiar route despite the same assist level and riding conditions, it’s a strong indicator that the motor is overcompensating for bad sensor data. The sensor is telling the motor you’re pushing harder than you are, so the motor delivers more power, draining the battery. Some systems allow for a “zero torque reset” at home, which can sometimes fix minor drift. This usually involves a specific button combination on the display during startup to re-establish the baseline for “no pedal pressure.”
However, a true recalibration is firmly in the “dealer tool only” category. This is because it involves more than just setting a zero point; it requires writing new calibration parameters directly to the motor’s firmware. This process is protected by a secure protocol.
The Digital Handshake for Sensor Calibration
As detailed by dealers, professional torque sensor recalibration is a multi-step, secure process. The dealer’s diagnostic tool initiates a ‘digital handshake’ with the component. It runs a mandatory diagnostic sequence to ensure the sensor is functioning within expected parameters. Only after receiving a ‘pass’ signal from this sequence does the tool receive authorization from the manufacturer’s server to write the new calibration data to the motor’s firmware. This secure, two-way verification ensures that calibration is performed correctly and on a healthy component, a safeguard that is impossible to replicate with a consumer app.
Checking for Water Ingress in Connector Ports
While we often focus on complex software errors, some of the most common and damaging issues are brutally physical. Water ingress into electrical connectors is a prime culprit for a host of seemingly random electronic gremlins. Display communication errors, intermittent power loss, or a battery that refuses to be recognized can often be traced back to a few drops of water in the wrong place.
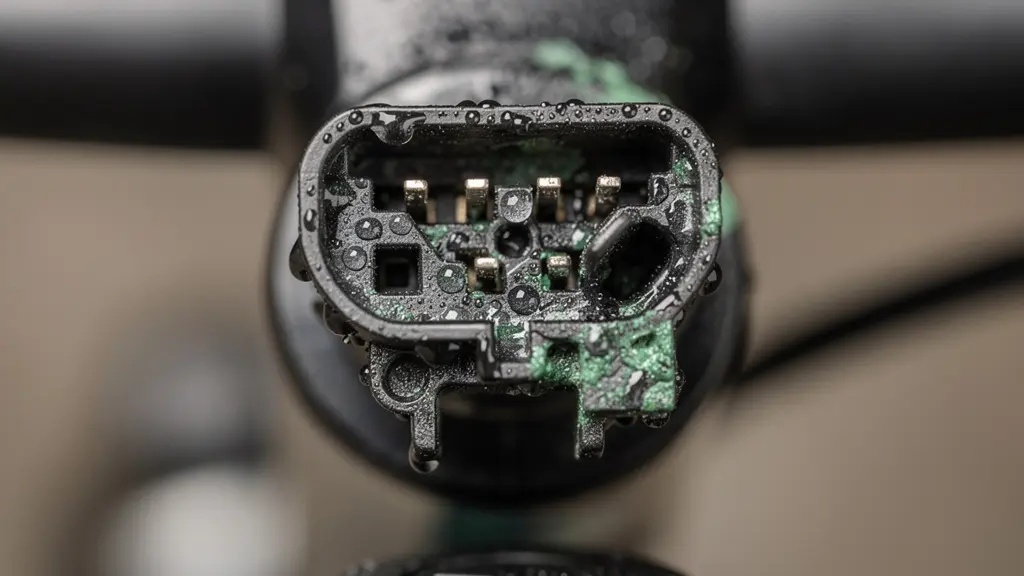
The diagnostic process here is visual. You’re looking for the tell-tale signs of corrosion: a faint green or white powdery residue on the metal pins of your connectors. The most obvious places to check are the main battery terminals and the connection point for your display unit. However, the hidden failure points are often the ones that cause the most headaches. These include the speed sensor connector on the chainstay, the main wiring harness entry point into the motor casing, and the tiny connectors for your brake sensors, which cut motor power when you brake. The macro photo below shows exactly what to look for—the subtle but destructive pattern of oxidation on connector pins.
A proactive, data-driven approach is to link maintenance to your ride log. If you use an app that tracks weather, set a recurring calendar reminder to perform a connector check after any ride flagged as “rain.” This turns a random inspection into a scheduled maintenance task. Prevention is even better: applying a thin layer of dielectric grease to connector seals and pins doesn’t hinder electrical flow but provides a robust barrier against moisture. It’s a simple, cheap, and effective hardware-level fix that can prevent countless hours of software-level frustration.
How to Pair Your Heart Rate Monitor with the Bike Display
Pairing a heart rate monitor (HRM) to your e-bike display seems like a feature for fitness enthusiasts, but for a tech-savvy owner, it’s a powerful, untapped diagnostic tool. By correlating your own biological output (heart rate) with the bike’s mechanical output (power assist, speed, battery consumption), you create a highly sensitive bio-diagnostic system. Your body becomes the most crucial sensor on the bike.
The core principle is establishing a baseline. When your bike is new and running perfectly, you record your average heart rate for a specific assist level on a standard route. For example, “Route A on ‘Tour’ mode = 135 bpm average.” You now have a performance benchmark. If, weeks later, you ride the same route under similar conditions and find your heart rate is now averaging 150 bpm to maintain the same speed, it’s a clear, data-backed indication that something is wrong. The bike is less efficient, and your body is working harder to compensate.
This early warning can predate a mechanical failure or a noticeable drop in battery range by weeks. It could indicate increased drag from a binding brake, a dry chain, or the first signs of motor bearing wear. A recent Transportation Research study highlighted this effect, finding that riders tracking this data could identify efficiency losses long before they became obvious mechanical problems. By comparing the increase in your heart rate against the increase in battery consumption, you can even start to isolate the problem: if both go up proportionally, it’s likely a drag issue; if your heart rate goes up but battery use doesn’t, the issue might be with your own fitness that day!
Why Only Dealers Can Reset Error Codes on Premium Systems
The inability for a user to reset a “hard” error code is not a technical oversight; it’s a fundamental feature of the system’s safety and legal architecture. When a dealer clears a critical fault, they are doing more than just pressing a button. They are participating in a logged, auditable event that carries legal weight. This is the core of the liability firewall manufacturers build around their products.
A ‘hard code’ reset by a dealer is a legal and safety event. The dealer tool creates an indelible log entry stating the fault was acknowledged and checked by a professional, protecting the manufacturer from liability if a user were to bypass a critical safety warning.
– Sarah Thompson, eBike Shop Owner, Car Scan Tool Professional Guide
The technical implementation of this is a process called a ‘digital handshake.’ When a dealer tool is connected to a bike to clear a critical error (for example, a brake sensor failure), it doesn’t just wipe the code. First, the tool must authenticate itself with the manufacturer’s central servers. This confirms it’s a legitimate, registered tool. Then, the tool is often required to run a mandatory diagnostic sequence on the component in question. Only after the component passes this test and the server sends back an authorization token can the error be reset.
This creates a permanent, cloud-based record of the event: which dealer, on what date, reset which specific error on which bike’s serial number after a successful diagnostic test. This protects the manufacturer from warranty fraud and, more importantly, from liability if a user were to try and bypass a critical safety fault that later caused an accident. It ensures that a professional has physically verified that the underlying issue is resolved before the bike is cleared for use again. This server-side verification is why even “cracked” versions of dealer software are unable to perform these critical functions.
Key Takeaways
- Battery State of Health (SoH) is a degradation curve to be tracked over time, not just a static number.
- Triage error codes at home using a Green (DIY), Yellow (Monitor), Red (Dealer) framework to manage issues efficiently.
- The dealer-app divide is a ‘liability firewall’; write-access to critical systems is locked for safety and legal reasons, not just business.
Integrated Handlebars vs Standard Stems: Is the Clean Look Worth It?
The trend towards fully integrated cockpits, where brake lines and electronic wires are routed internally through the handlebars and stem, creates a beautifully clean aesthetic. From a developer’s perspective, however, it represents a significant challenge to diagnostics and maintenance. It prioritizes form over function, turning simple troubleshooting into a complex, labor-intensive task. With a standard stem and handlebar, a visual inspection of a cable or a quick disconnection to test a component takes minutes.
With an integrated system, this same task can require the complete disassembly of the cockpit, including removing bar tape, brake levers, and shifters, just to access a single wire. A simple display communication error, which might be a 10-minute fix on a standard setup, can escalate into hours of labor. This has a direct and significant financial impact. A recent 2024 Wertgarantie study found that repair costs for issues within integrated cockpits were, on average, 3.5 times higher than for identical issues on standard setups. That $20 cable fix suddenly becomes a $250 service appointment, purely due to access constraints.
The choice between these two systems is a classic trade-off between aesthetics and serviceability. As a tech-savvy owner who values the ability to diagnose and perform minor maintenance, this is a critical consideration when purchasing a new e-bike. The table below starkly illustrates the diagnostic impact of this design choice.
| Aspect | Integrated Cockpit | Standard Stem |
|---|---|---|
| Visual cable inspection | Impossible without disassembly | 10-minute check |
| Display error diagnosis time | 2-3 hours labor | 30 minutes |
| Cable replacement cost | $150-300 + labor | $20-50 + DIY possible |
| Error code troubleshooting | Total reliance on app | Visual + app diagnosis |
| Preventive maintenance | Professional only | DIY inspection possible |
| Aesthetic appeal | Clean, aerodynamic | Visible cables |
Your e-bike is constantly communicating. Start listening by applying these diagnostic principles today to transform your maintenance from reactive to predictive. The clean look might be tempting, but the long-term cost of diagnostic complexity is a factor that no savvy owner should ignore.