Your e-bike is no longer just a vehicle; it’s a dynamic sensor actively co-designing the city of the future.
- Ride data informs everything from traffic light timing to infrastructure safety evaluations.
- This process turns individual route choices into powerful ‘votes’ for urban development priorities.
Recommendation: Understand the data you generate to consciously participate in shaping a smarter, safer urban environment.
The sensation of gliding through city streets on an e-bike is one of personal freedom and efficiency. For most riders, the journey is the destination. But beneath the hum of the motor and the spinning of the wheels, a silent conversation is taking place. Every acceleration, every turn, and every stop is a piece of data—a digital breadcrumb that contributes to a vast, invisible blueprint. We often think of smart city data in terms of static sensors and public transit logs, but the real revolution is far more personal and kinetic.
The common understanding is that e-bike data helps planners decide where to put new bike lanes. While true, this barely scratches the surface. This perspective misses the profound transformation underway: your e-bike is becoming a mobile, kinetic sensor feeding the central nervous system of the modern metropolis. Each ride is not just a trip from A to B; it is a ballot cast with data, influencing everything from traffic signal synchronization to emergency response strategies.
What if the true power of micromobility lies not just in reducing congestion, but in actively programming the city in real-time? This guide moves beyond the basics of GPS tracking. We will explore how your individual actions are aggregated into a collective intelligence, turning you from a simple commuter into a co-architect of the urban future. We will dissect the technology that allows your bike to ‘talk’ to the city, uncover how to leverage open data for your own safety, and weigh the futuristic balance between personal mobility and autonomous systems.
This article provides a comprehensive look into the data-driven dialogue between you and your city. The following sections break down the core components of this emerging relationship, from the communication protocols of tomorrow to the practical survival skills needed today.
Summary: Smart Cities and the E-Bike Data Revolution
- Vehicle-to-Everything: Will E-Bikes Talk to Traffic Lights Soon?
- How to Use Open City Data to Find the Safest Routes
- E-Bike vs Autonomous Pods: The Future of Short Trips
- The Risk of Sharing Your Home Location via Riding Apps
- When Will Smart Helmets Become Mandatory for Insurance?
- Heatmaps vs Official Trails: Finding the Quietest Routes
- Green Waves: Adjusting Speed to Hit Every Light
- Survival Guide: Navigating Complex Intersections on an E-Bike
Vehicle-to-Everything: Will E-Bikes Talk to Traffic Lights Soon?
The concept of Vehicle-to-Everything (V2X) communication is the cornerstone of the next generation of urban mobility. It envisions a world where vehicles, infrastructure, and even pedestrians are in constant digital dialogue to prevent collisions and optimize flow. While cars are the primary focus, the integration of e-bikes into this urban nervous system is not science fiction; it’s the logical next step. Imagine your e-bike broadcasting its position and speed, prompting a traffic light to extend the green phase for a few extra seconds to allow a group of cyclists to pass safely. This is the promise of Cellular-V2X (C-V2X), the technology poised to dominate the market.
The transition is already happening. In a landmark decision, the U.S. Federal Communications Commission (FCC) mandated a full transition away from older DSRC technology to C-V2X, setting a clear path for a unified communication standard. This ensures that safety-of-life messages have the highest priority across the network. Projections show that over 90% of the V2X market will use 5G-based C-V2X by 2034. For the e-bike rider, this means your vehicle will soon become an active node in the city’s safety grid. Your presence will be ‘felt’ by autonomous cars and smart intersections long before it is seen, drastically reducing the potential for conflict in complex urban environments.
This shift reframes the e-bike from a simple transport tool to a dynamic data contributor. It’s no longer just about your journey; it’s about how your journey informs and safeguards the journeys of everyone around you. The data you generate won’t just be a passive record but an active signal contributing to a city-wide symphony of coordinated movement.
How to Use Open City Data to Find the Safest Routes
While the future promises interconnected safety systems, today’s urban cyclist must be a proactive data analyst. Smart cities are increasingly making their data public through open portals, offering a treasure trove of information for the savvy rider. This isn’t just about finding the most direct route; it’s about building a personalized safety map based on historical incident data, traffic flow, and real-world rider behavior. By becoming your own data scientist, you can design routes that actively mitigate risk.
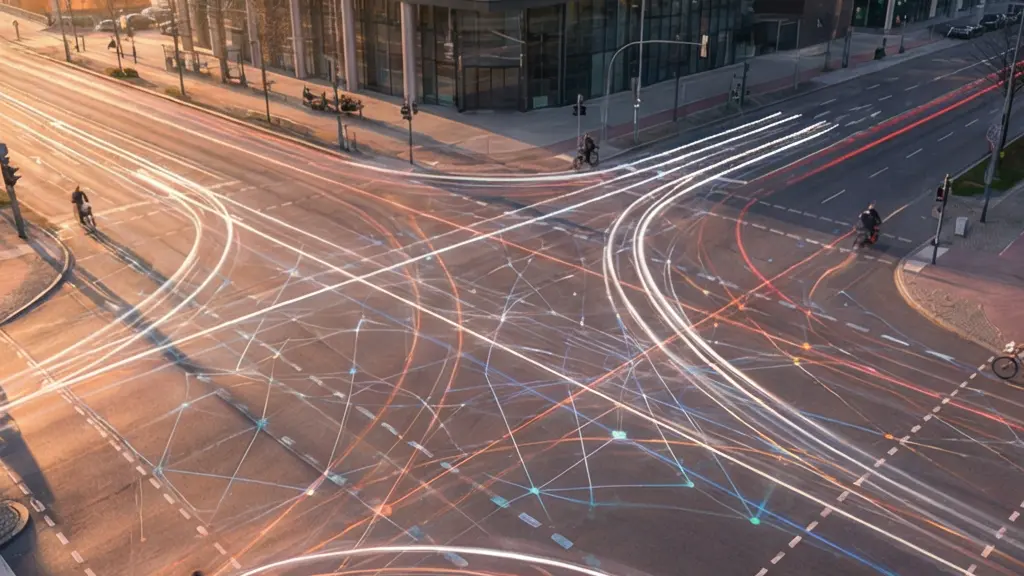
This proactive approach is critical because intuition can be misleading. For instance, while we often perceive intersections as the most dangerous spots, CDC data reveals that 59% of bicyclist deaths actually occur on road sections away from intersections, often due to factors like vehicle speed and lack of protected lanes. This is where open data becomes a powerful tool for survival, allowing you to identify these dangerous mid-block segments and avoid them.

The image above captures the essence of this new reality: the rider as a strategist, using layers of information to chart the safest path. You are no longer just following a line on a map; you are navigating a complex data landscape. By fusing official city data with crowdsourced insights from platforms like Strava, which highlight hard-braking events, you can create a “risk heatmap” that is far more nuanced than any official bike map. This turns trip planning from a simple chore into an act of strategic self-preservation.
Your Action Plan: Create a Personalized Safety Map
- Access Data Portals: Start by finding your city’s open data portal and look for police accident reports and traffic volume datasets.
- Download Accident Records: Use resources like CYCLANDS to download granular cycling accident data for your area.
- Overlay Data: Use mapping tools (like QGIS or even Google My Maps) to layer accident severity data over your regular commuting routes.
- Cross-Reference Crowdsourced Info: Check platforms like Strava for heatmaps showing hard-braking events, which indicate near-misses and poor infrastructure.
- Identify Patterns: Look for high-risk areas and analyze patterns related to time of day, weather, or specific maneuvers.
- Define Buffer Zones: Create digital “no-go” or “high-alert” zones around dangerous spots and actively plan alternative routes.
E-Bike vs Autonomous Pods: The Future of Short Trips
The urban landscape is on the cusp of a revolution in short-trip transportation, with two key players emerging: the e-bike and the autonomous pod. While both promise to solve the “last mile” problem, they represent fundamentally different philosophies of urban movement and data generation. The e-bike champions active, engaged transport, turning the citizen into a kinetic sensor. The autonomous pod, in contrast, offers passive, service-based transit, reducing the user to a simple data point of origin and destination.
The momentum behind micromobility is undeniable. As noted by industry analysts, the scale of this shift is massive. Tamobyke Research highlights this in their recent report:
With the global micromobility market projected to reach $300 billion by 2030 and 157 shared micromobility trips taken across the U.S. and Canada in 2023 alone, e-bikes are reshaping how we conceptualize urban transportation.
– Tamobyke Research, Sustainable Urban Mobility Report 2025
This explosive growth underscores the value of the e-bike’s data model. Unlike a pod, which requires dedicated, often privatized urban space for pickup and drop-off, e-bikes integrate seamlessly into existing infrastructure. More importantly, they generate a far richer dataset. An e-bike doesn’t just report a start and end point; it provides a continuous stream of information about route choice, speed modulation, braking patterns, and even rider effort. This is invaluable data for planners looking to understand the granular reality of how citizens interact with their environment.
The following table breaks down the core differences in how these two modes contribute to the smart city’s digital twin.
| Aspect | E-Bikes | Autonomous Pods |
|---|---|---|
| Data Points Generated | Rich actor dataset (speed, route choice, braking patterns, effort) | Simple passenger point (origin, destination) |
| Infrastructure Required | Bike lanes, charging points | Dedicated pickup zones, privatized space |
| Urban Space Usage | Integrates with existing infrastructure | Requires dedicated zones |
| User Engagement | Active participation | Passive transportation |
The Risk of Sharing Your Home Location via Riding Apps
As we celebrate the power of e-bike data, we must also confront its shadow: privacy. The very data that empowers urban planners can become a significant personal liability if handled improperly. Every ride tracked on an app contributes to a detailed digital profile, and when rides frequently start and end at the same location, it becomes trivial to identify a rider’s home or workplace. This creates a “digital breadcrumb trail” that could be exploited by malicious actors for theft or stalking.
The problem is one of aggregation. A single ride is innocuous, but hundreds of rides create a pattern of life that is deeply personal. Many popular riding apps encourage sharing for social motivation, but they often lack robust, user-friendly privacy controls. Features like “privacy zones,” which obfuscate the start and end points of a ride, are a step in the right direction, but they are often not enabled by default or are poorly understood by the average user. The responsibility currently falls on the individual to navigate a complex web of settings to protect their location anonymity.

This challenge is not just about personal security; it’s about trust in the entire smart city ecosystem. For the “urban nervous system” to function effectively, citizens must be willing to share data. If they fear that their participation will expose them to risk, they will opt out, and the data stream will dry up. Therefore, developing robust, transparent, and user-centric privacy standards is not an obstacle to the smart city—it is a prerequisite for its success. The future lies in technologies that can anonymize and aggregate data at the source, providing valuable insights to planners without ever exposing individual identities.
When Will Smart Helmets Become Mandatory for Insurance?
The conversation around e-bike data is rapidly expanding from urban planning to risk management and insurance. Insurers are data-driven entities, constantly seeking better ways to quantify risk and incentivize safer behavior. The emergence of smart helmets—equipped with sensors for impact detection, accelerometers, and even communication capabilities—presents an unprecedented opportunity for them. It’s no longer a question of *if* this technology will influence insurance premiums, but *when* it will become a decisive factor, or even mandatory.
We are already seeing a global precedent for technology-driven safety regulations. These rules create the framework that insurance companies will eventually leverage.
Case Study: China’s 2024 E-bike Safety Regulations
In a significant move, China implemented revised Safety Technical Specifications for e-bikes in September 2024. These rules included a strict 25 km/h speed cap enforced by GPS cutoffs and mandated other advanced safety features. The impact was immediate and profound, with early 2025 data showing a 45% reduction in fire incidents related to e-bikes. This demonstrates a clear link between enforced technology standards and measurable safety outcomes—a formula that is highly attractive to the insurance industry.
Smart helmets and e-bikes are also becoming hubs for health data, recording metrics that go far beyond simple crash detection. They can monitor heart rate, exertion levels, and ride duration, painting a holistic picture of a rider’s health and behavior. An insurer could offer lower premiums to a rider who demonstrates consistent, safe riding habits and maintains a good level of physical activity, as verified by their helmet and e-bike sensors. This creates a powerful incentive loop: safer riding leads to lower costs, which encourages wider adoption of safety technology. The smart helmet could soon be to e-bike insurance what the black box is to auto insurance—an essential tool for personalized risk assessment.
Heatmaps vs Official Trails: Finding the Quietest Routes
For many urban riders, the goal is not speed but serenity. The desire to escape the noise and congestion of main arteries is a powerful motivator. This is where data interpretation becomes an art form. Official bike maps show designated trails, but they don’t capture the lived experience of a route—its noise level, traffic stress, or overall pleasantness. Crowdsourced heatmaps, like those from Strava, offer a more democratic and nuanced view of where people *actually* ride, providing clues to finding those hidden gems.
The key is to learn how to read between the bright red lines. A popular route on a heatmap isn’t necessarily a good one; it might just be the most obvious or unavoidable. The real value lies in identifying the less-traveled “green” or “blue” lines that run parallel to major corridors. These are often the quiet residential streets or forgotten paths that offer a more peaceful journey. This is about finding the “desire lines” of tranquility, not just the desire lines of efficiency. Your own rides contribute to this collective knowledge, casting a data vote for the routes you find most enjoyable.
Interpreting these heatmaps requires a critical eye. A brightly lit route with a low average speed might indicate heavy congestion or a steep hill, not a pleasant, leisurely ride. To find the truly quiet paths, you need to cross-reference multiple data points:
- Look for low-density routes: Seek out the faint lines, not the blazing ones.
- Compare heatmaps with elevation profiles: A quiet, flat route is often the ideal.
- Analyze directional flow: Check morning vs. evening heatmaps to find routes that go against the main flow of commuter traffic.
- Identify parallel alternatives: The best quiet routes are often just one or two blocks away from a noisy main road.
By using data to seek out silence, you are not only improving your own riding experience but also signaling to urban planners that demand exists for infrastructure that prioritizes low-stress, enjoyable cycling over pure, utilitarian speed. Every quiet ride you log helps build the case for a more human-centric city.
Green Waves: Adjusting Speed to Hit Every Light
One of the most elegant applications of smart city technology is the “green wave,” a system where traffic signals are timed sequentially to allow for a smooth flow of traffic at a certain speed. While traditionally designed for cars, cities like Copenhagen are pioneering this concept for cyclists. This transforms the commute from a frustrating series of stops and starts into a fluid, uninterrupted dance with the city’s rhythm. It’s a prime example of civic gamification, where the system rewards an individual’s optimal behavior for the benefit of the entire network.
The system works by using real-time data from cyclists to dynamically adjust signal timing. In Copenhagen, AI-powered traffic lights monitor the flow of bikes and optimize the light sequences to favor the largest groups. For a rider, this means that maintaining a steady speed—typically around 20 km/h (12.4 mph)—significantly increases the chance of hitting every green light along a major corridor. This reduces travel time and energy expenditure, making cycling an even more attractive option. According to reports on the system, it has reduced stops for cyclists by up to 30%.
This is where the e-bike rider becomes a key player in the urban orchestra. Your consistent speed and predictable movement provide the high-quality data that these AI systems need to function. You are not just a beneficiary of the green wave; you are a participant who helps create it. Every time you adjust your speed to “catch the wave,” you are reinforcing the pattern and making the system more efficient for those behind you. It is a beautiful symbiosis: the city provides a framework for efficiency, and the rider’s actions fine-tune its performance. This is the urban nervous system in its most poetic form, a seamless dialogue between individual and infrastructure.
Key Takeaways
- Your e-bike is an active sensor, and your route choices are ‘data votes’ that influence urban planning.
- Open city data, when combined with crowdsourced heatmaps, is a powerful tool for creating personalized safety maps.
- The future of urban mobility involves a trade-off between the rich data from active transport (e-bikes) and the convenience of passive transport (pods).
Survival Guide: Navigating Complex Intersections on an E-Bike
Now that we have explored the futuristic potential and strategic possibilities of e-bike data, we must ground ourselves in the present-day reality of urban riding. The most critical moments of any ride occur at intersections, the complex nodes where all forms of traffic converge and conflict. While smart infrastructure is evolving, navigating these spaces today requires vigilance, defensive riding, and a practical understanding of risk. The data is stark: although most fatal incidents occur elsewhere, intersections remain hotspots for collisions.
According to safety analyses, the urban environment is where cyclists are most vulnerable. Comprehensive safety statistics reveal that 81% of cyclist deaths occur in urban areas, with a significant portion—29%—happening specifically at intersections. This underscores the need for a specific skill set tailored to these high-risk zones. It’s about more than just knowing the rules of the road; it’s about anticipating the behavior of others and making yourself as visible and predictable as possible. This includes mastering lane positioning, making eye contact with drivers, and understanding the limitations of a driver’s visibility.
Your role as a kinetic sensor extends even to these moments of high alert. When you navigate a particularly dangerous intersection, your braking patterns, speed adjustments, and route choices are valuable data. Many companion apps and platforms like SeeClickFix allow you to tag and report dangerous intersections, turning a moment of personal risk into a data point for future improvement. You are not just surviving the intersection; you are helping the city identify and eventually redesign it. Your experience becomes the catalyst for building safer infrastructure, such as the Protected or “Dutch” Intersections that physically separate bikes from cars, for everyone.
Frequently Asked Questions about E-Bikes and Smart City Data
How can I report a dangerous intersection after encountering it?
Use apps like SeeClickFix or your e-bike’s companion app to tag dangerous intersections immediately after navigating them, contributing to urban improvement data.
What data should I check before approaching an unknown intersection?
Review hard-braking heatmaps, rider comments on platforms like Strava, and check accident history data from open city portals.
What are the safest intersection designs for cyclists?
Dutch Junctions and Protected Intersections separate bike traffic from vehicles through physical barriers and dedicated signal phases, reducing conflict points by up to 50%.